Wrangle your data.
Grow makes it easy to prepare, cleanse, and transform data across multiple data sources to fuel powerful metrics and dashboards.
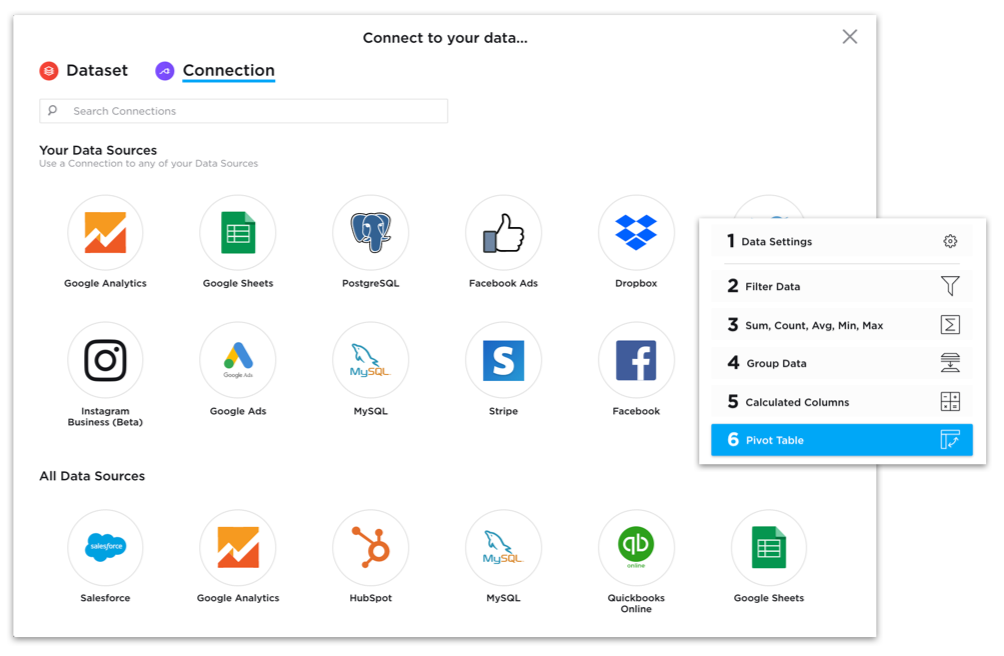
Connect your data.
Native integrations connect to the most commonly used platforms, databases, and CRMs to import data seamlessly via APIs that continually import and refresh data, so your metrics are up-to-date and reliable when you need to make critical business decisions.
Grow offers the following native integrations:
Databases
Grow supports databases most commonly used by disruptors, including MySQL, SQL Server, Postgres, Redshift, and BigQuery.
CRM
Native Salesforce, HubSpot, Infusionsoft, Copper, and Pipedrive connectors import and blend data to help you understand lead acquisition to closed revenue and CLTV.
Ad Platforms
Import advertising data from Facebook, Google, Microsoft, LinkedIn, and Twitter to determine how to best optimize your marketing budget.
Social Media
Connect and blend data from your social media channels to understand prospect and customer engagement on Facebook, Instagram, LinkedIn, Twitter, and YouTube.
Accounting & Financials
Keep a pulse on critical finance and accounting KPIs, including cash, revenue, expansion, and churn with native Quickbooks Online, Xero, and Banking integrations.
Marketing Analytics
Understand how site visitors engage by importing data from your digital analytics platforms—HubSpot, Google Analytics, or Google Search Console.
Files
Grow provides flexibility by supporting data imports from files via integrations with Google Sheets, Google Drive, Dropbox, Box, Excel/CSV Upload, OneDrive, Airtable, Smartsheets, and Amazon S3.
Get your data ready.
Once your data is imported, it's easy to prepare, cleanse, & transform data—allowing you to blend multiple data sources to fuel metrics and dashboards. Grow supports the following transformations:
Non-SQL Transformations
Leverage No Code Transforms that write SQL behind the scenes with support for the following:
- Filter & Group
- Summary Stats
- Custom Calculations: Sum, Count, Average, Min, & Max
- Rename Columns
- Tag (Case Statements) & Time-Shifting
- Joining: Left, Right, Outer, Inner, & Cross
SQL Transformations
Write custom PostgreSQL to transform one or more data tables. Leverage the power of PostgreSQL, one of the most advanced query languages currently available, to explore more advanced data structures, like arrays and JSON.
All your data in one place.
Grow imports your business-critical data and keeps the most relevant and current data on hand, so you don’t need a third-party data warehouse.
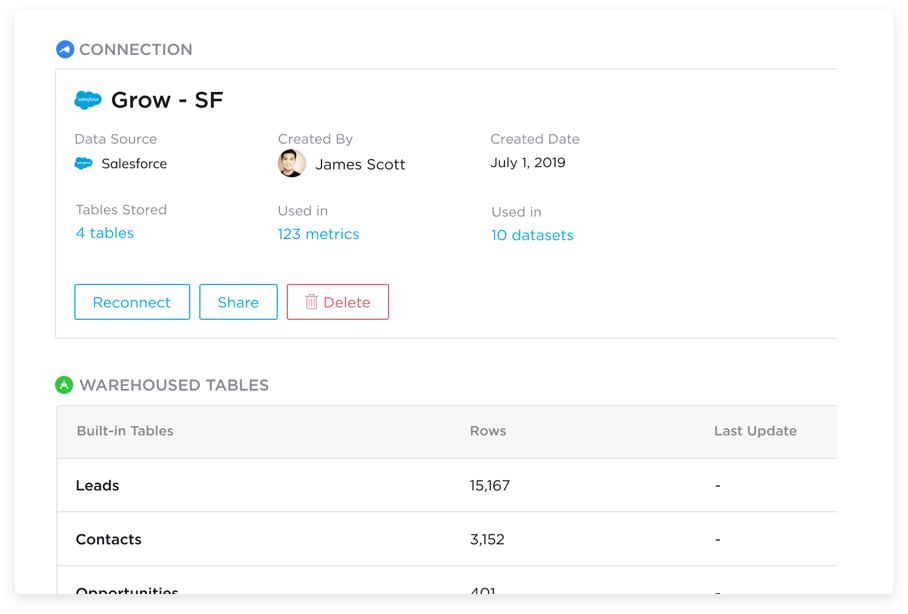
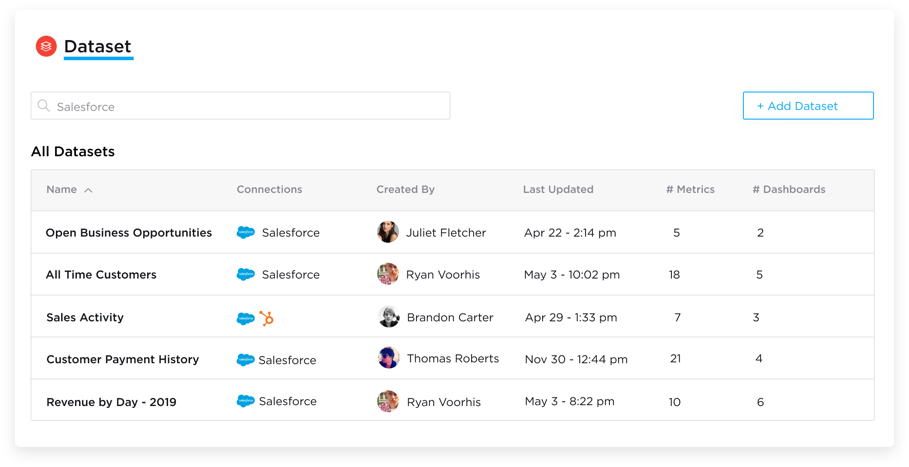
Connections & data modeling.
Establish a connection and store your data in Grow to deliver transformative insights you can’t achieve otherwise. Create datasets that incorporate custom business logic into a single source of truth that everyone can use.
Connect to Raw Data
Connect to a data source and indicate what data you want to pull and store in Grow.
Permissions
Assign and authorize access to the raw stored tables to users within your business who need access.
Storage Flexibility
Store historical snapshots of a single row or entire tables, depending on your reporting needs.
Simple Datasets
Data models that have cleaned and transformed a single source of data to get you up and running quickly with basic metrics.
Custom Datasets
Access reusable data tables that combine multiple data sources to jumpstart building metrics and dashboards.
Data Transparency
See how much data you have stored in Grow, as well as any issues or errors with data that need to be reconciled.
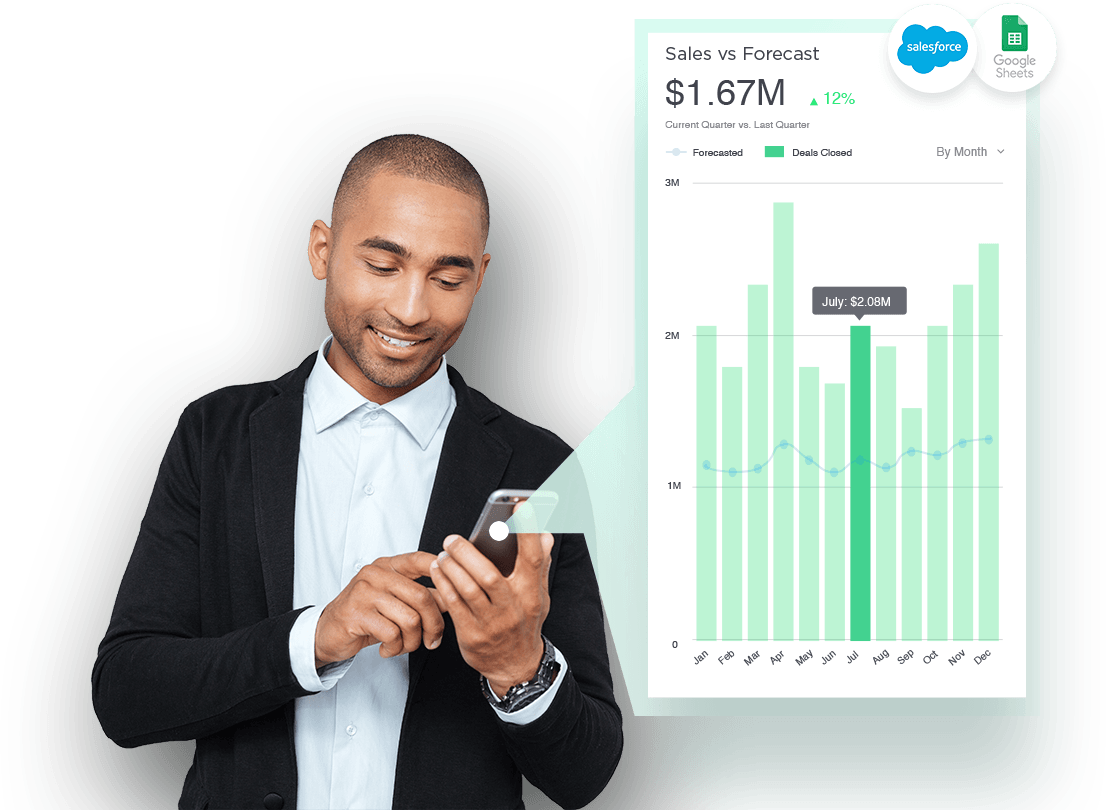
Build metrics in minutes.
Easily marry and transform disparate data sources, and then filter, slice, and explore different visualizations as you navigate your data to find the best way to surface insights for your business.
Data Explorer
Define how you want to navigate your data via charts and graphs, displayed in metrics and dashboards that drive business decisions.
Chart Types
A variety of chart types to explore your data:
- Series: Column/Bar/Line/Area graphs.
- Non-Series: Bubble, Radar, Funnel, Table, Map, Pie, Bullet, and Gauge.
- Special: Image, HTML, & Single Value.
Explore & Build Custom Views
Manipulate time series data by limiting what you show to a specific time period and grouping data by time ranges.
- Filter: show data that aligns with specified criteria.
- Slice: pivot your data to display it by some categorized groupings.
- Compare Dates: display your data in comparison to a prior time period.
- Sort & Limit: limit and organize the data displayed when there is no time-based component.
- Key Values: summarize your data into a single value, and optionally compare it with another value.
Dashboards
Create a collection of metrics to answer questions from your data that address a specific use case or provide insight for a team.
Dashboard Filtering
Dynamically change displayed metric data based on date, number, or categorical logic.
- Date Range: change what data is displayed by a specific time period.
- Date Grouping: change how displayed data is grouped by a specific date interval.
- Filtering: define a category, number, or date filter that can be used globally.
Dynamic Dashboards
Dynamically display data based on who is logged into the account.
Dashboard Blueprints
Leverage pre-built, single data source dashboards to jumpstart getting insights quickly from your data.
Custom & Sandbox Dashboards
Blend data to build metrics and dashboards tailored to your business’s needs; build in-progress dashboards in a sandbox prior to deploying to a live dashboard.
Navigate Your Data
View trends and patterns more easily through data visualizations that span a number of chart types—from column and bar charts to gauge, funnel, and area charts.
Easily ask the next question of your data, metrics, and dashboards through powerful filtering, slicing, and drilling features.
Dashboard Metric Filtering
Dynamically change the filters and grouping of all the metrics on a dashboard using date, number, or categorical logic.
Individual Metric Filtering
Dynamically change the filters and grouping of a metric, based on date, number, or categorical logic.
Drilling
Click on a grouping within a chart to see the raw transactional data that makes up the aggregated visualization.
History
Allows you to view the historical state of your metric's data based on previous run times.
Chart Type
Temporarily change the chart type of a metric to display data differently. For example, change from a column to line chart.
Expanded Mode
View and interact more in-depth with a single metric on the dashboard.
Chart vs. Table
Switch from the metric chart view to a table view to see what the underlying data looks like.
Share insights with everyone.
Achieve business agility, excel at in-moment prioritization, and share decision-making power with every employee with simplified and automated reporting.
Share a dashboard via email and create a delivery schedule for PDF reports to be sent to stakeholders on a regular basis.
TV Mode
Display a dashboard on a TV to get insights and metrics in front of your whole team and company. Configure different display modes such as dark mode and the ability to cycle through metrics on a timer.
Shareable URLs
Generate and share public URLs for each dashboard, so anyone can view dashboards without having a login.
Slack
Immediately post an individual metric to a slack channel (DM coming soon), or schedule it to post on a recurring basis.
Export
Tables of raw and transformed data can be exported from each metric and report.
Customize Grow
Keep your brand front and center when employees and customers access Grow.
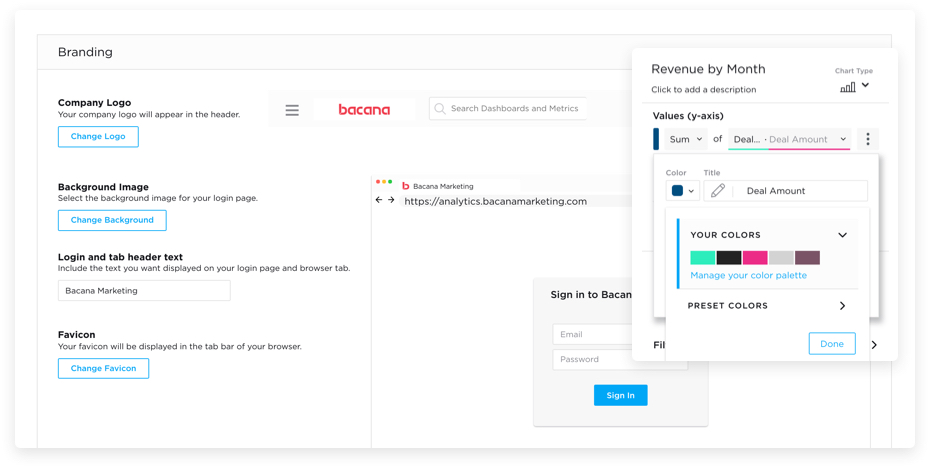
Logo
Display your logo within Grow.
Favicon
Upload your own favicon.
Custom Domain
Access Grow dashboards through your own URL.
Login Screen
Customize your login page with your own image, welcome message, and domain.
Email Setup
Setup your own email system to send automated branded emails from your domain.
Set Custom Color Scheme
Set a reusable palette that you can use to make all your metric visualizations adhere to your brand.