Our biggest release yet, is out now.
We are so excited to introduce the latest version of the Grow platform, Grow 6. 17 different features across the whole app, and including some of our most requested features and improvements.
This new release is live in your Grow account today.
Power to the Analyst, Simplicity for the Business User
Companies invest in business intelligence to get insights from their data, to know what happened and why it happened. BI allows you to answer any question from your data.
Good decisions are key to your growth and Data is at the heart of those good decisions. Since many of us are now working remote, everyone making decisions need access to the right data. This is more important now than ever before.
However, traditional Business Intelligence is broken. When you lock the data into complex, enterprise tools, it's not accessible to business users. Everyone goes to the analyst for their request. This isn’t effective and scalable for the analyst. We have talked to so many people that say, “because of how technical it is, I can’t explore or modify the answers I get, I have to keep going back to the analyst, so pretty soon I just stop going back.” And that’s when they stop looking at the data.
Our mission at Grow has always been to free the insights in a powerfully simple way for business users AND analysts. To support that mission, we’ve always had and always will have an unlimited user model.
We are so excited to introduce the latest version of our platform, Grow 6.
The secret sauce of the Grow 6 release is that we increased the power and scalability for the analyst while improving and simplifying the features for everyone, that make exploring data and getting insights faster and easier than ever before.
6 Categories of New Features
All the new features break down into these six categories.
1. Data Storage and Capacity
2. Data Management
3. Data Explorer
4. New & Faster transforms
5. New Sharing Tools and Experience
6. Architecture & Security
Data Storage & Capacity
Data Warehouse
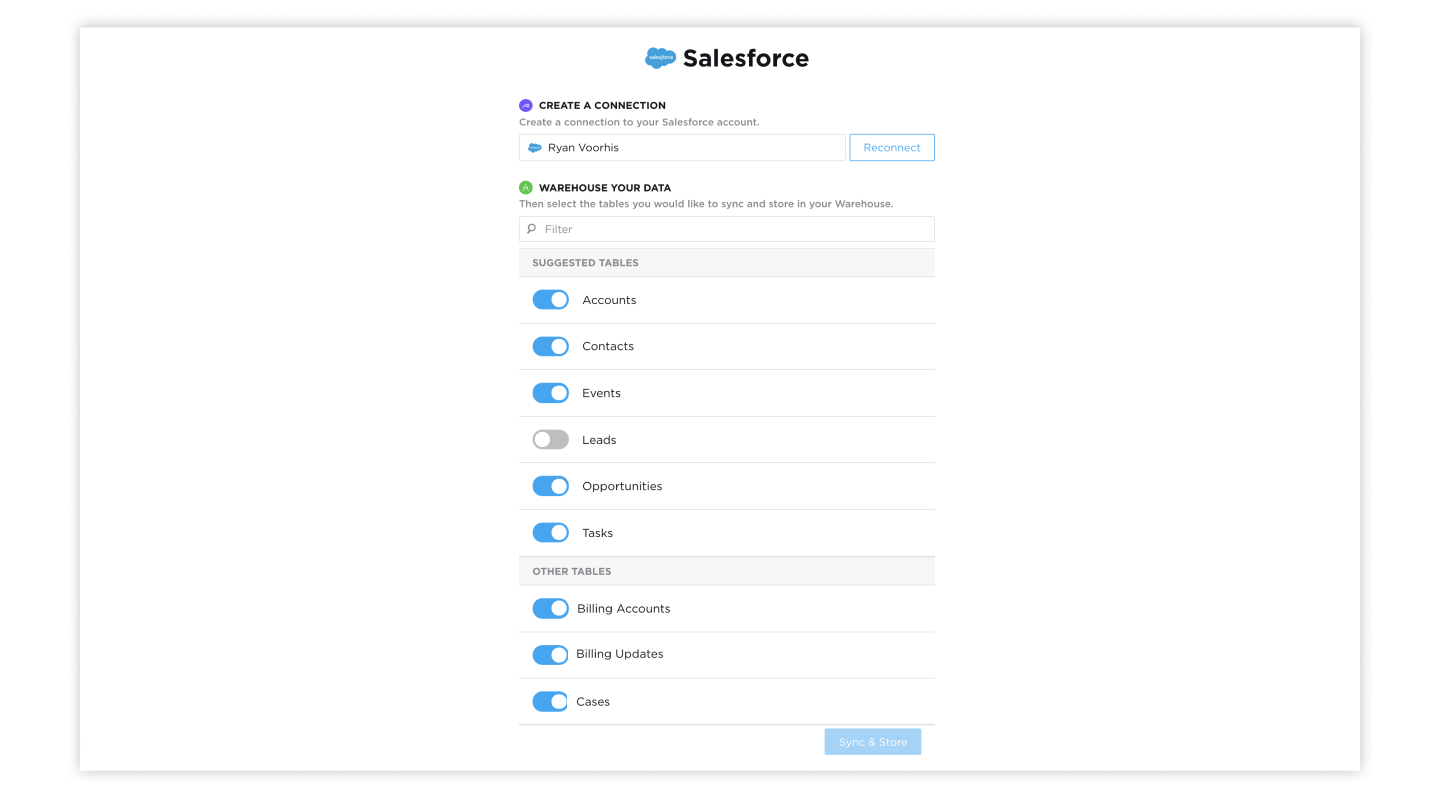
- Most businesses use 10+ apps to run their business. With a data warehouse, you own your data. With all your data in one location, you can have a central source of truth. You can run as many queries on your warehouse and ask it as many questions as you want, without being limited by API speeds, and limits.
- Connect to 9+ data sources. Pick which tables you want to connect to, and the warehouse immediately begins pulling and storing all your data securely. Build datasets of the warehouse tables so anyone at your company can get the data they need to make great decisions.
Data Management
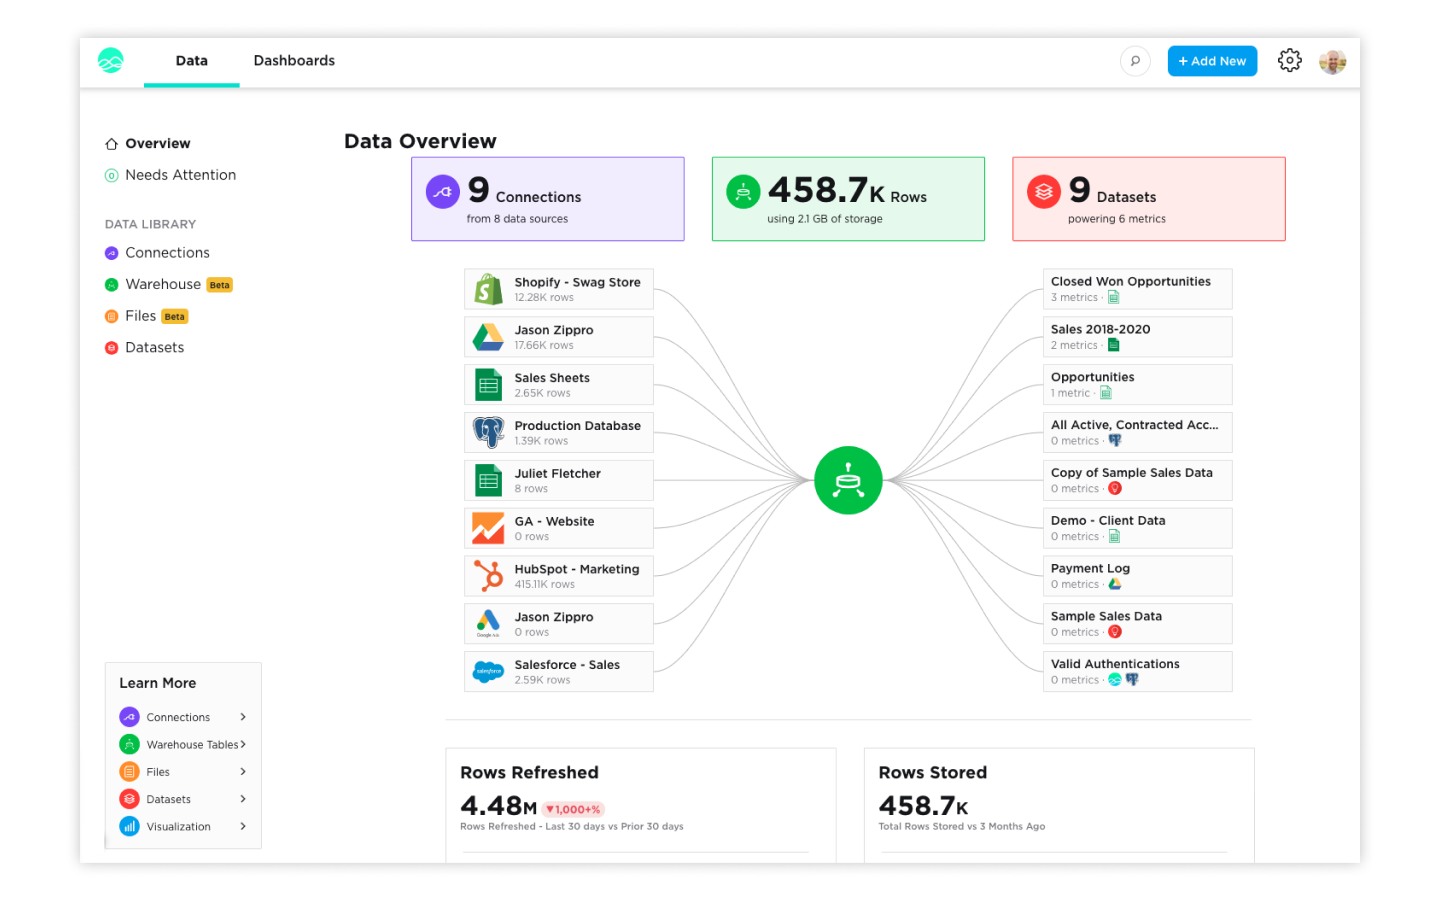
Data Overview
- Data is the lifeblood of your business and the Data Overview page is the place where you can see and manage it all. Here you can see your all Connections, Warehouse tables, and Datasets. Manage access to connections, see when Warehouse tables last updated, and verify Datasets.
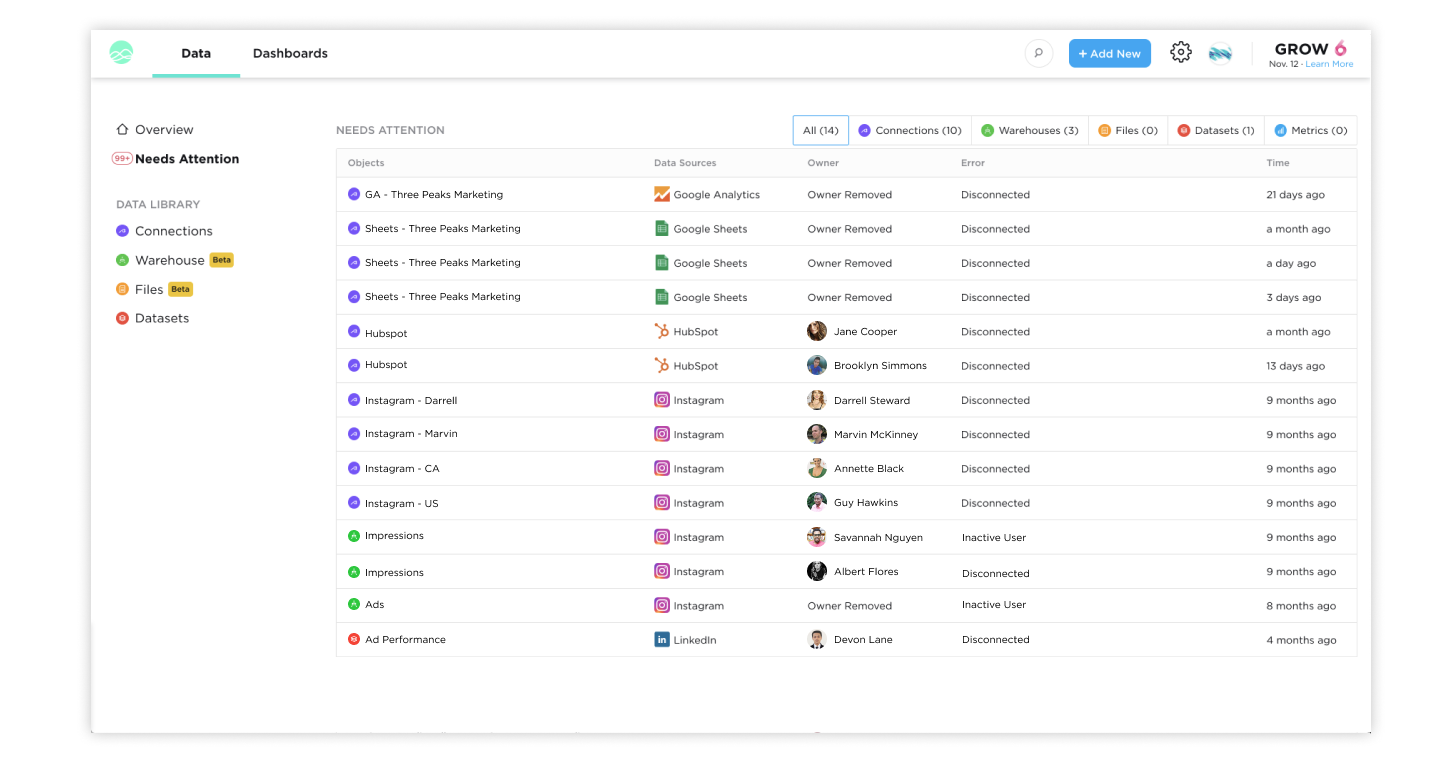
Needs Attention page
- Pulling and getting insights from your data can be complex. When things go wrong, they pop up on the Needs Attention page so you can fix that fast. The Needs Attention page surfaces Connections, Datasets, and Metrics where something went wrong and need an analyst or admin to fix them. Instead of having to hunt through your account by hand as you maintain your data, all the items that need your attention are presented to you.
- When items arise, you will see the red number notification on the Needs Attention page. Click the tab to see a list of items. Click the item to go straight to where you can fix the issue.
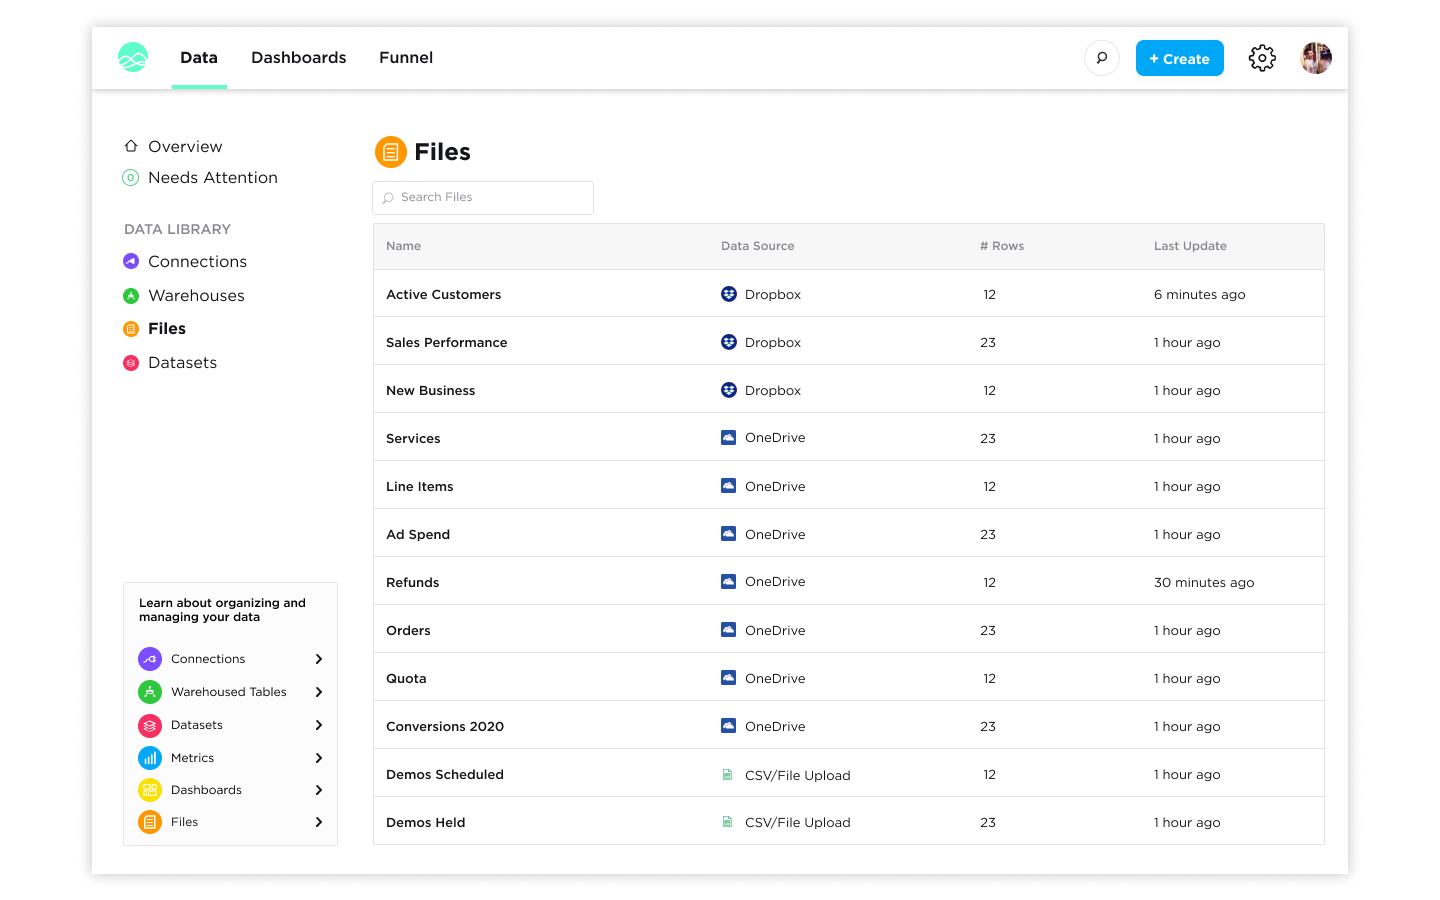
Files Management
- Grow is the single hub for all your data. The new Files Management page makes it easy to use and manage any of the csv and Excel files you need to analyze and create visualizations for. You can switch out files as the data becomes outdated as well as manage access to files.
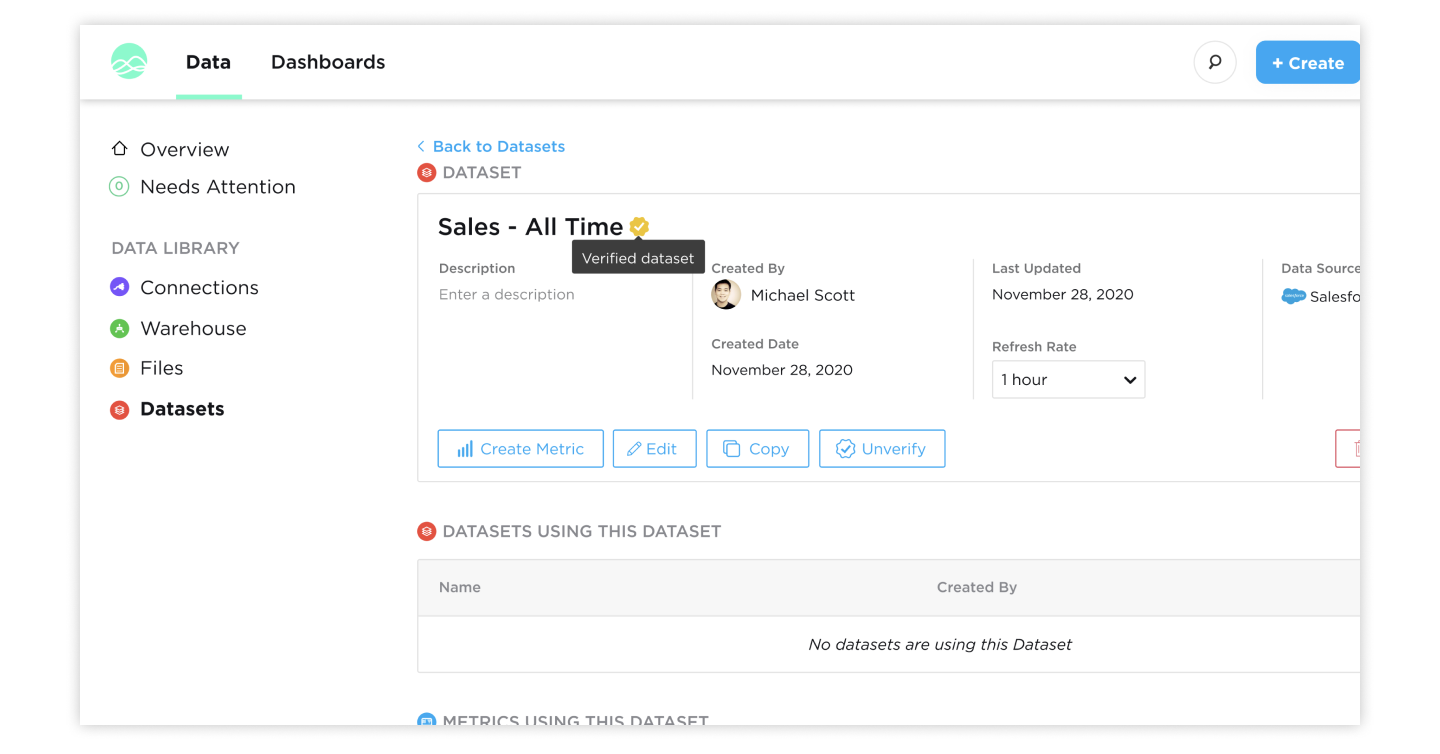
Verified Datasets
- Everyone in your company should be able to look at data to make decisions. But agreeing what data is correct can be hard. Avoid the file and definition ping pong with Verified Datasets. Admins and analysts can mark a Dataset as verified. This means the data and logic in that Dataset is correct and can be used by anyone in the company.
In the Data Tab, click on a Dataset. The new Verified button, when clicked, will add a verified badge to the Dataset name that appears in 4 locations:
- Datasets page on Data Tab
- Add Data modal in the Dataset and Metric Builder
- Data Settings page in the Dataset and Metric Builder
- Expanded View under the Details view
Data Explorer
Data Explorer (Builder)
- One good question always leads to another. Data Explorer is a new way to build metrics. Instead of having to change your data to answer a specific question, Data Explorer lets you indicate which columns you are interested in, and then change the groupings, slicing, filters, and visualizations on the fly. The transactional data is always preserved so you can always see the individual items that make up the number. Instead of answering one question with one metric, you can answer hundreds of questions.
- Pull in your data, pick the columns you want to see, then start exploring your data.
Dashboard Filtering
- Sometimes you want to see all the metrics on a dashboard in a new date range, grouping, or with a new filter. Dashboard Filtering makes it so you can edit any metrics built with Data Explorer with a single click.
- Change the date range, date grouping, or add filters to all metrics on a dashboard with a few clicks, directly on the dashboard.
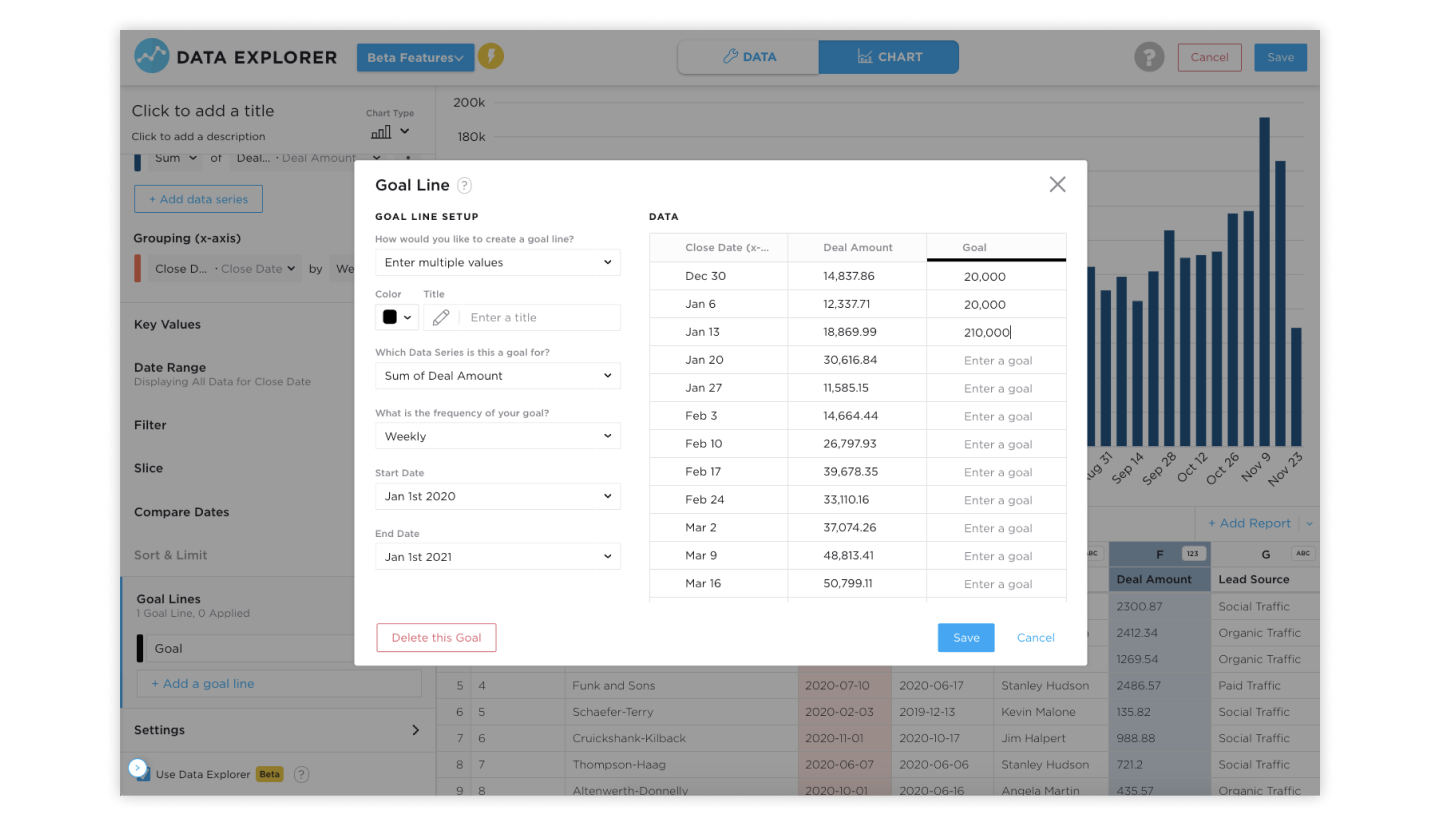
Goal Module
- Adding a goal line can be helpful in measuring your companies progress towards your goals. While your key value shows a snapshot of your actual performance, the goal line is a visual line on your metric that lets you compare your performance against your goal. You can define multiple goals with different groupings and time ranges so as you explorer your data, the goal will alway be accurate and up to date.
- In the Data Explorer, you can add a dynamic goal. Set the time period and group you are defining your goal for. For example do you have weekly, monthly or quarterly goals.
Improved Expanded Mode
- Expanded Mode is great for when you want to really drill into a metric and focus on it. You can use it as you present your metrics to a group or as you ask more questions from your data. The improved Expanded Mode makes it easier to see the transactional data behind your charts, as well as export data to csv for use in spreadsheets.
- Clicking the expand button will load your metric into the single use view. Filter, Drill, change the groupings or chat type, and export the filtered view you create to csv.
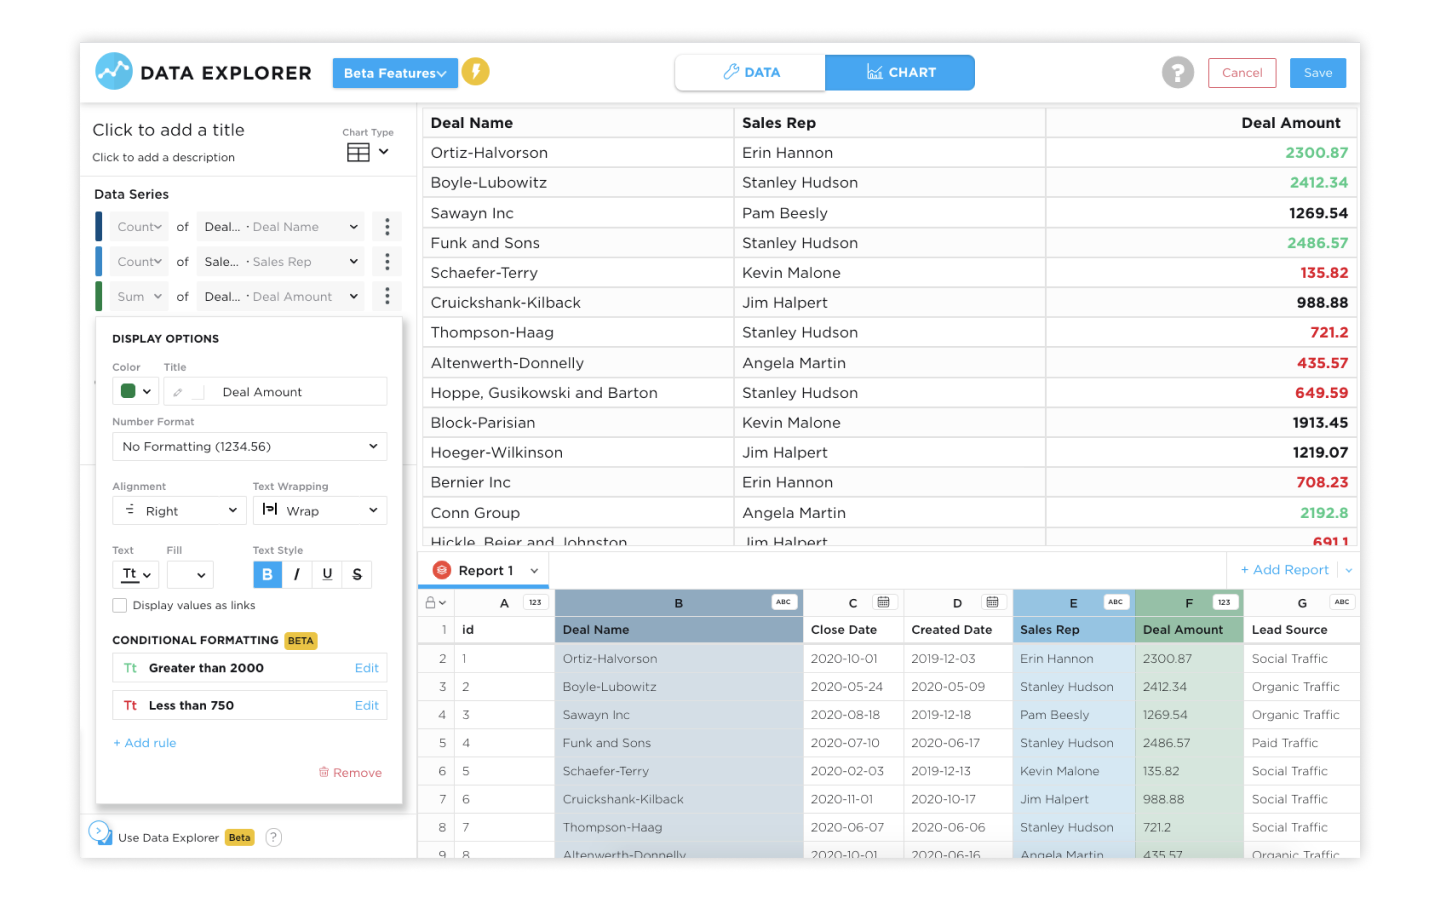
Table Chart Improvements with Conditional Logic
- Having to visually scan your data for anomalies or checking each row of a table mental against it expected value takes a lot of time. Conditional Logic allows you to set rules and then format your table against those rules. Show high performers in green or areas that need attention in yellow. If a number is below a goal, it can be bolded and the background turned red.
New & Faster Transforms
New Transforms in ETL
- Transforms allow you to clean and prep your data without knowing SQL. Many APIs return data structures instead of clean rows. The new JSON and Array transformations help you to format your data as clean usable rows. You can use the new transforms to break out JSON and Arrays into rows. You can define the JSON keys, all without knowing SQL.
Calculated Data Series
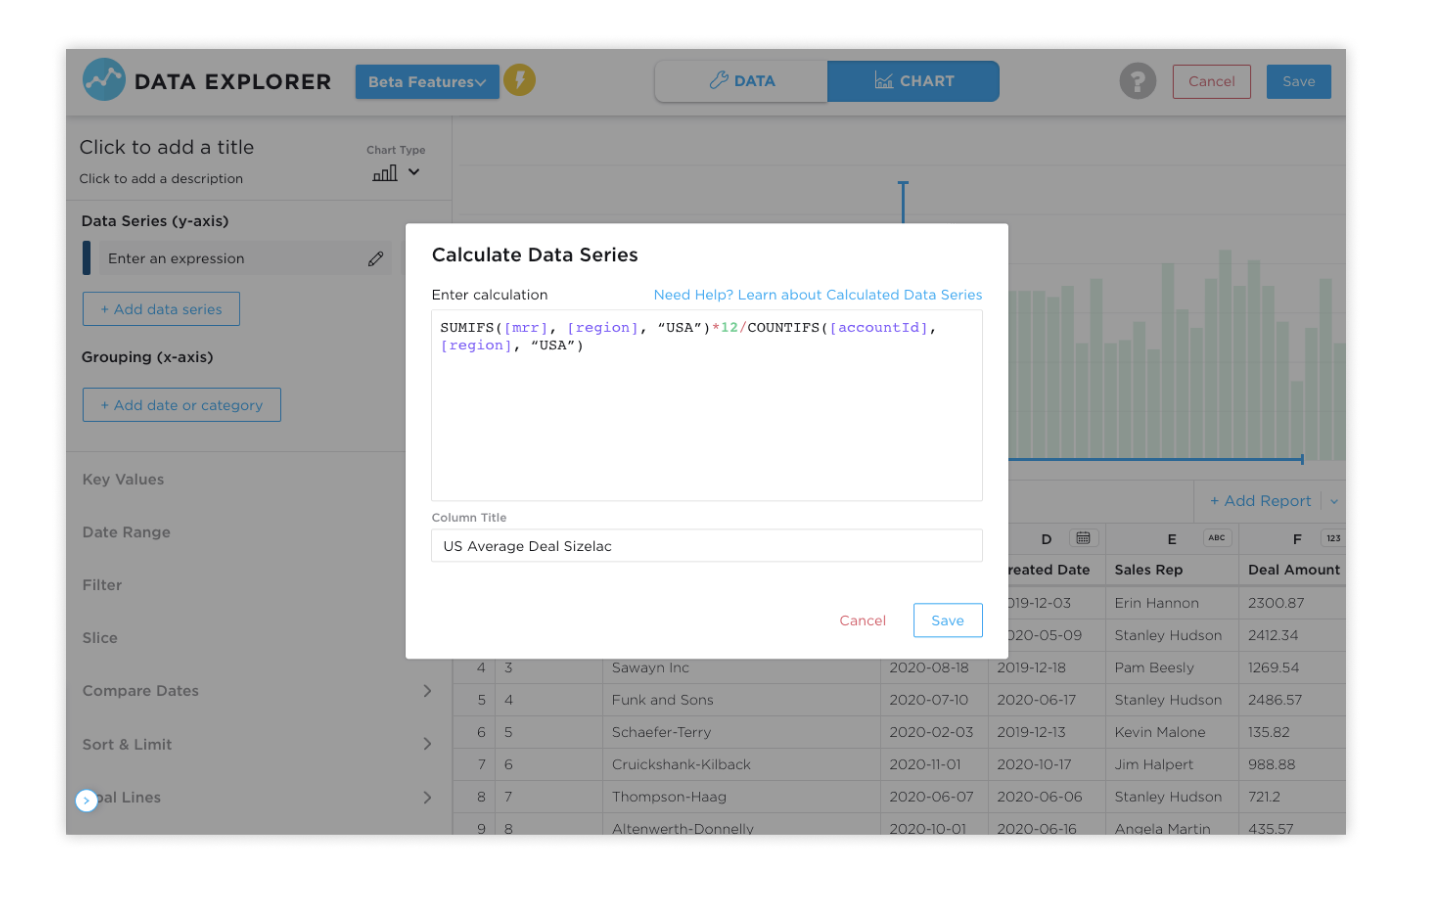
- Business Intelligence is all about comparing one number against another. With Calculated Data Series, you can enter complex formulas to answer any question you need, without SQL. Compare all sales with an upsell to total sales. Use the Sum If, Count If aggregation types to create formulas that will update automatically as you change the date range and date groupings of your metrics.
- Instead of just choosing an column in Data Explorer, you can open the ‘Calculate a Data Series’ modal. There you can use familiar Excel and Google Sheet like syntax to answer your questions.
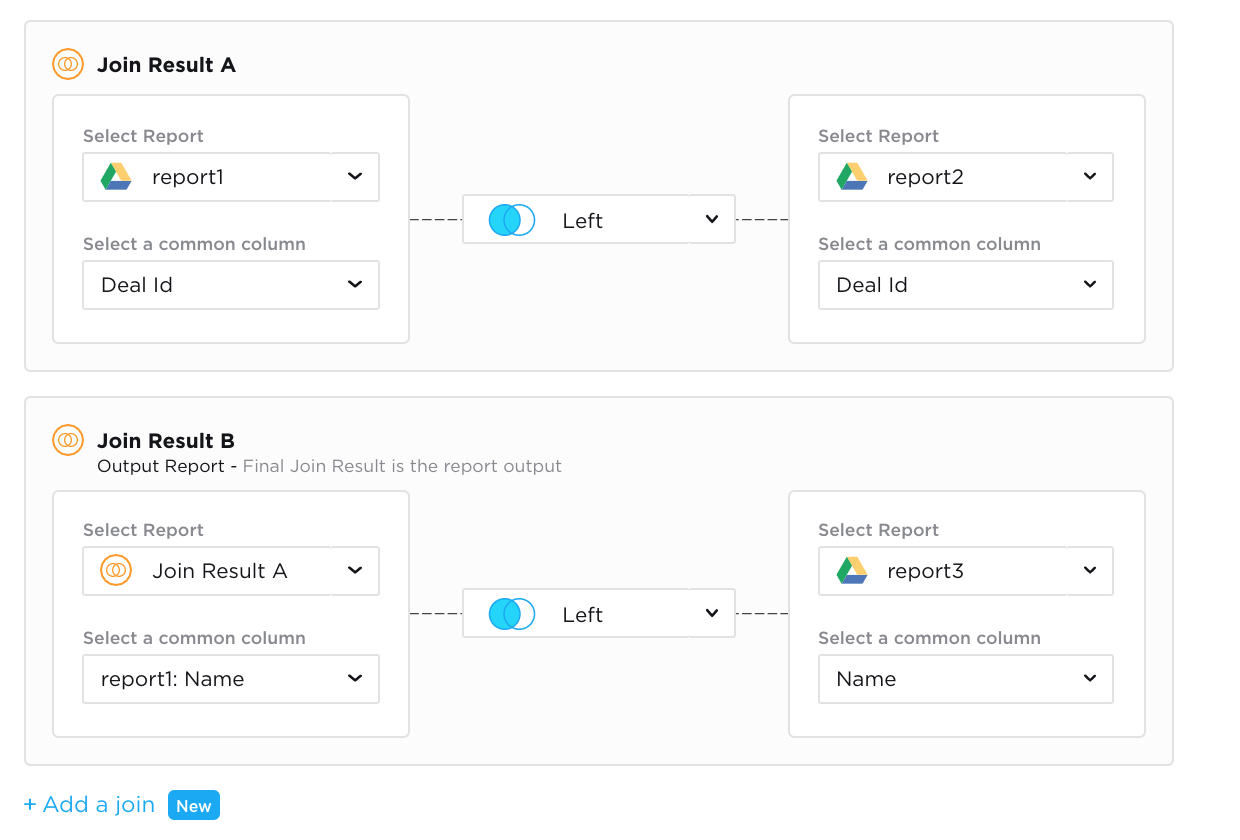
Multi-Joins
- Combining data from various data sources is one of the super powers of Grow. It allows you to answer questions you couldn’t from just a single source. By combining sales data with ads, you can see which ads drive the most revenue. With the new Multi-Join, you can join many reports into one with ease.
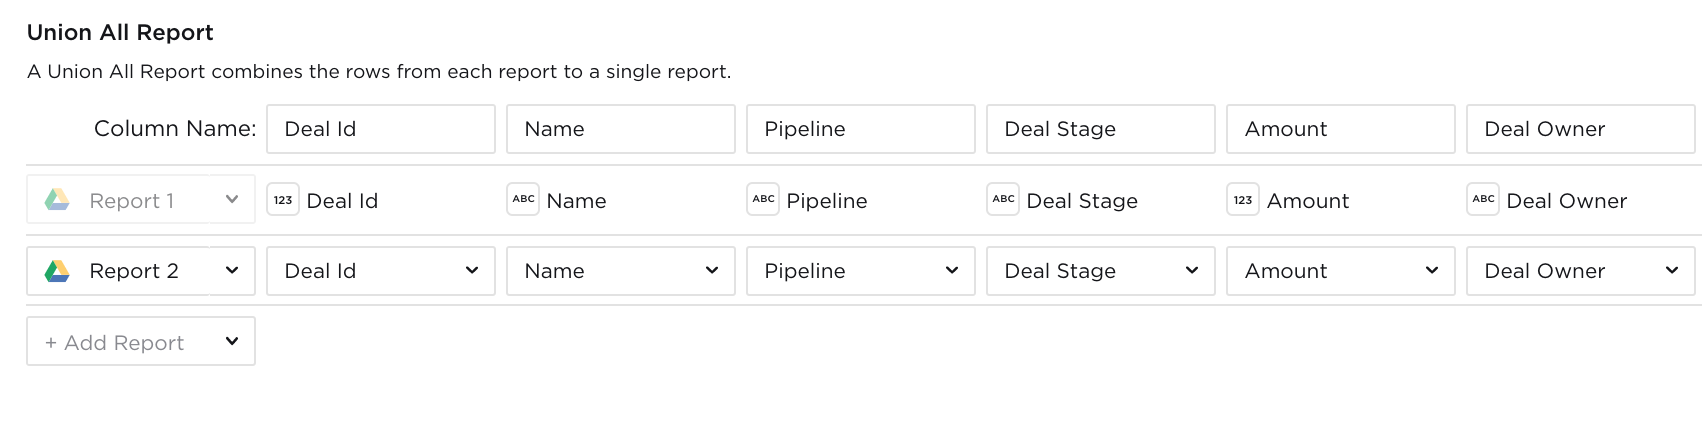
Union-All
- Sometime you need to combine different years of data into one report, or combine multiple different stores into one table that you can then use to visualize. The New Union All makes this possible with a few clicks, instead of having to use Master SQL.
- Select the reports you want to Union. If the data types and column orders match up, one click is all you need.
New Sharing Tools and Mobile Experience
- Your business is running all the time. We have unlimited users in Grow, but we also have great tools to share the data even when you can't be in front of your computer.
- The Grow mobile app for iOS and Android make it easy to track your numbers on the go. You can open any metric or dashboard in a few taps so you can always be connected to your business.
- We also improved our Export Tools making it easier to get the data where ever you need it.
- New Slack sharing options lets you send metrics immediately, or on a schedule.
Architecture & Security
Data Pods Architecture
- Each Grow customer now has their own Data Pod. This means that your companies data and processes run on their own powerful set of servers. Grow Data Pods make it so poorly written process that another analyst is running can’t affect your companies performance and power.
SOC II Compliance
- Keeping your data secure is our number one priority. Grow is now SOC II compliant and certified. This means independent auditors and testers have made sure Grow has the processes and procedures in place to make sure your data is safe and secure.

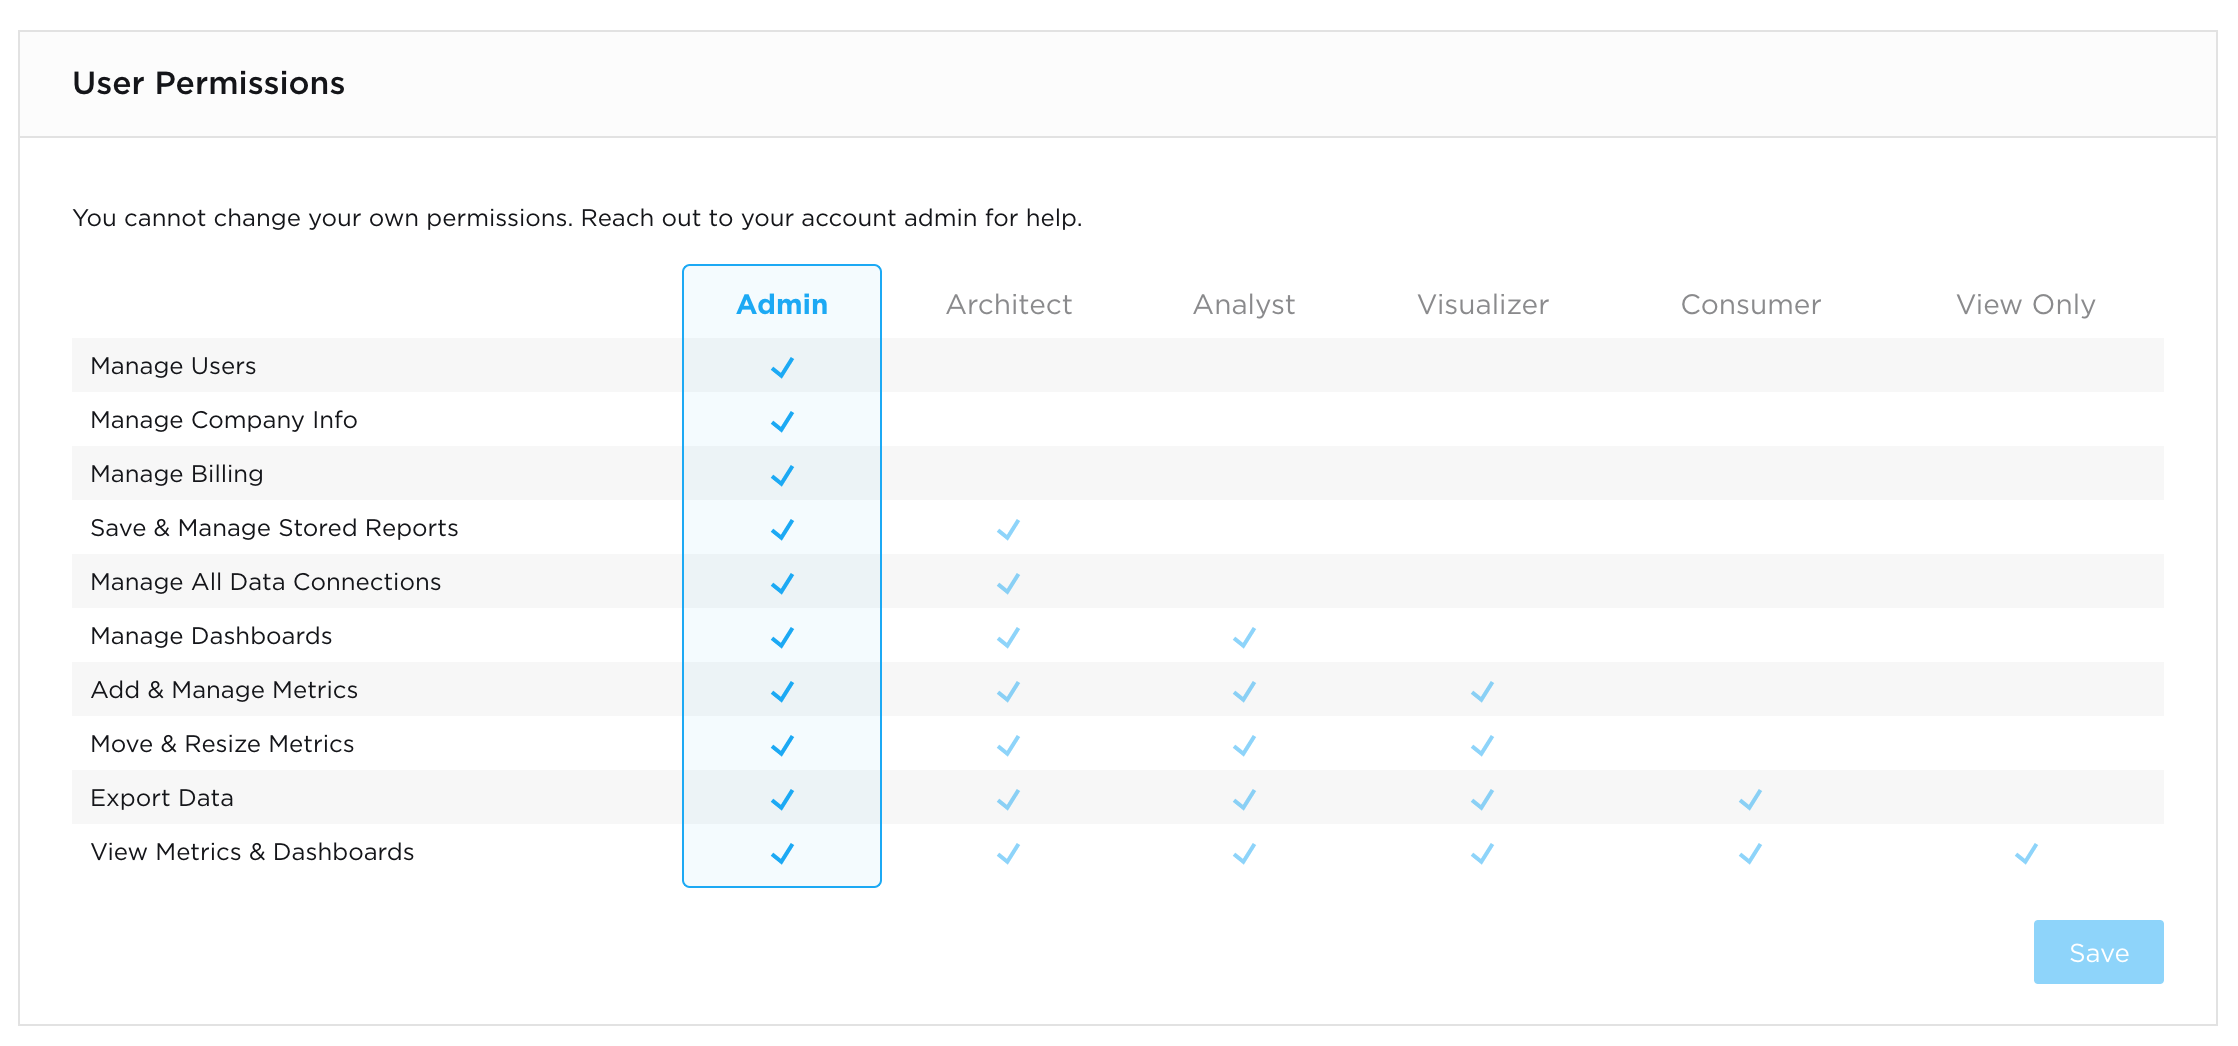
User Permissions
- Everyone at your company should be able to use data to make decisions. However, you may need to control who has access to what, and with what capabilities. With our new upgraded User Permissions, you can easily assign users to 6 new roles that make it clear, what they can and cannot do.
Grow 6, live now
If you're are a current Grow customer, all these new features are live in your account now! If you need some guidance you can go to our Help Center or reach out to our support team.
If you're not a Grow customer, what are you waiting for? Set up a free trial now.

.png)