Teams That Use This Dashboard
Executive
The Feel Good Lab is bringing a modern approach to pain relief. With better ingredients and better products, their 100% natural pain relief cream helps arm the body to do the work of healing—fixing the cause of pain and leading to recovery, instead of just covering up symptoms.
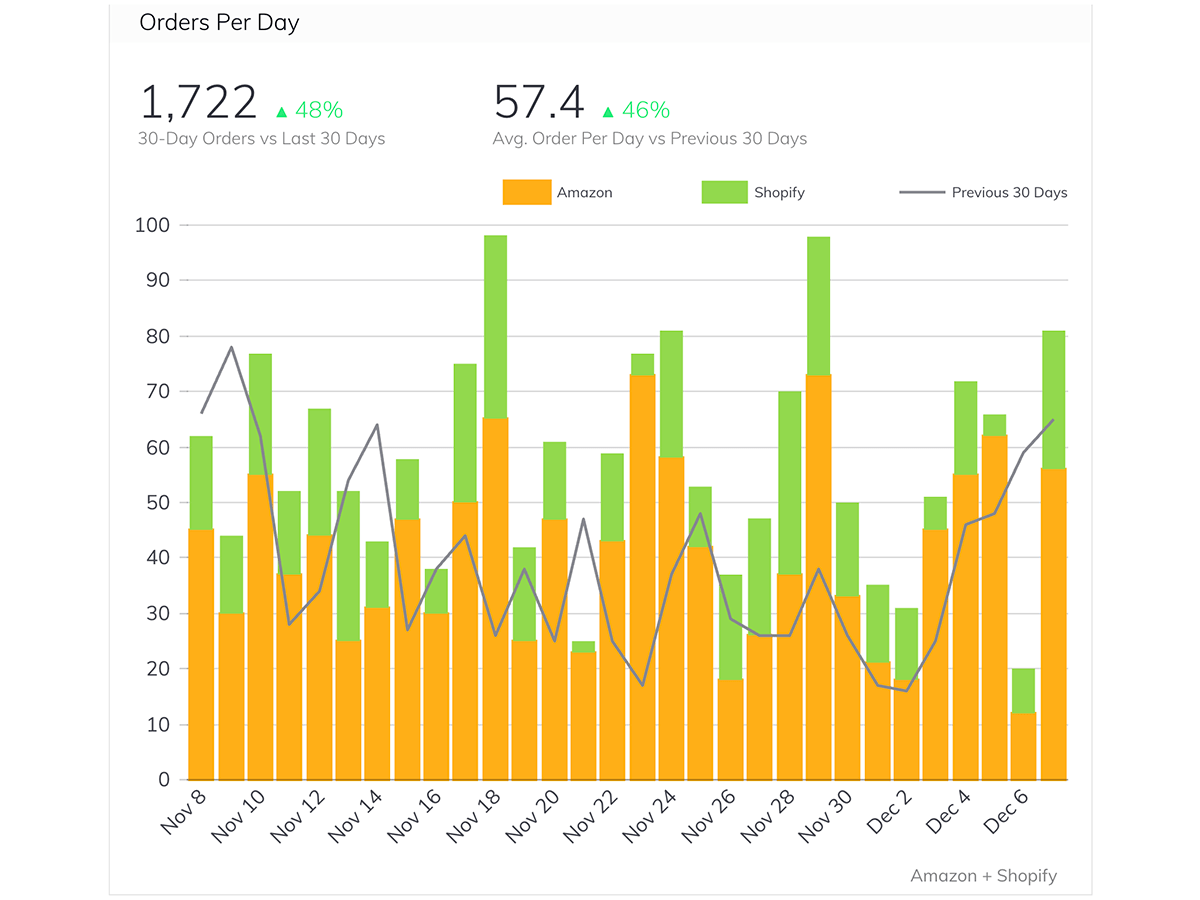
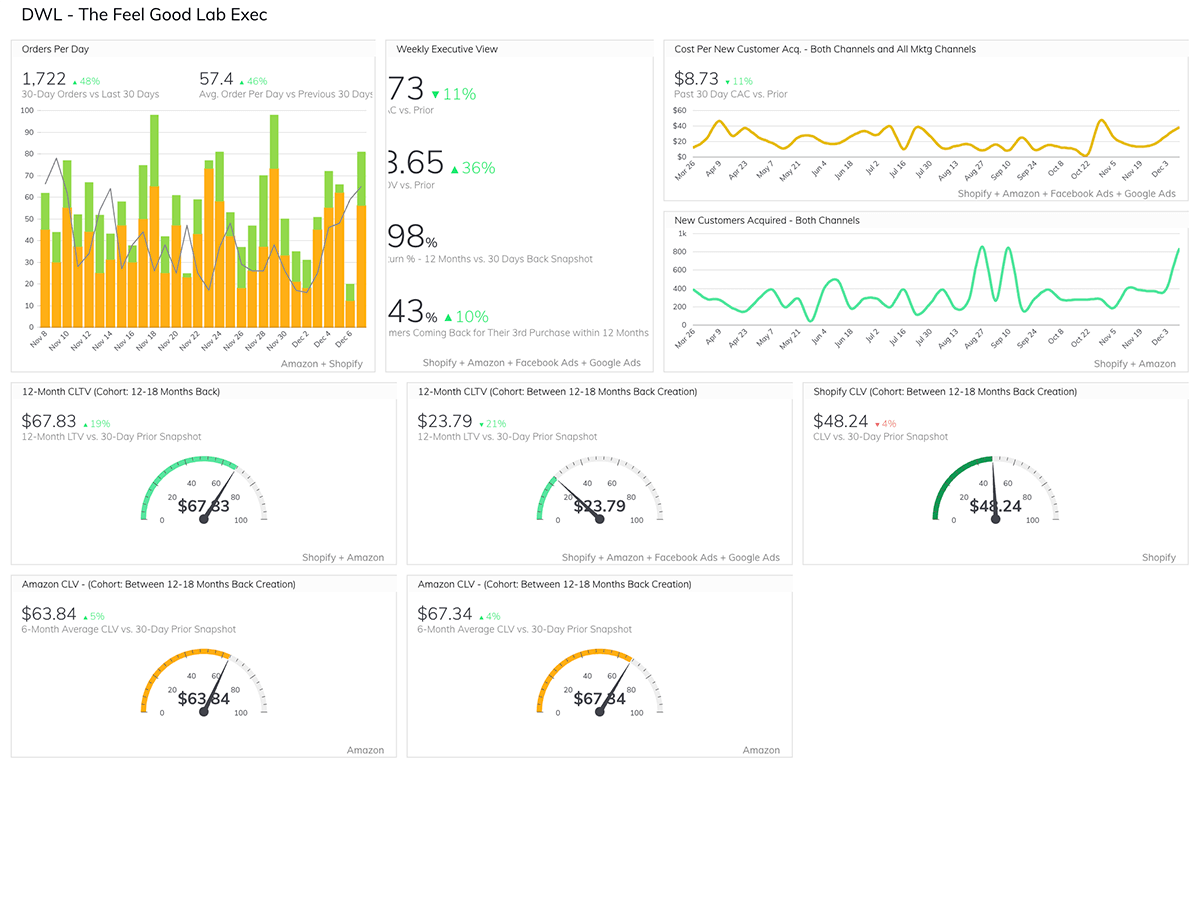
As a young business, The Feel Good Lab's executive team are keenly focused on growth and progress. During their weekly meetings, the executive team needs to know where they're growing and where they're falling short so they can direct company focus. Pulling data could easily eat up half their meeting, but because they can open up their dashboards and quickly see where they should be paying attention—the first step to diagnosing problems and staying on the right track.
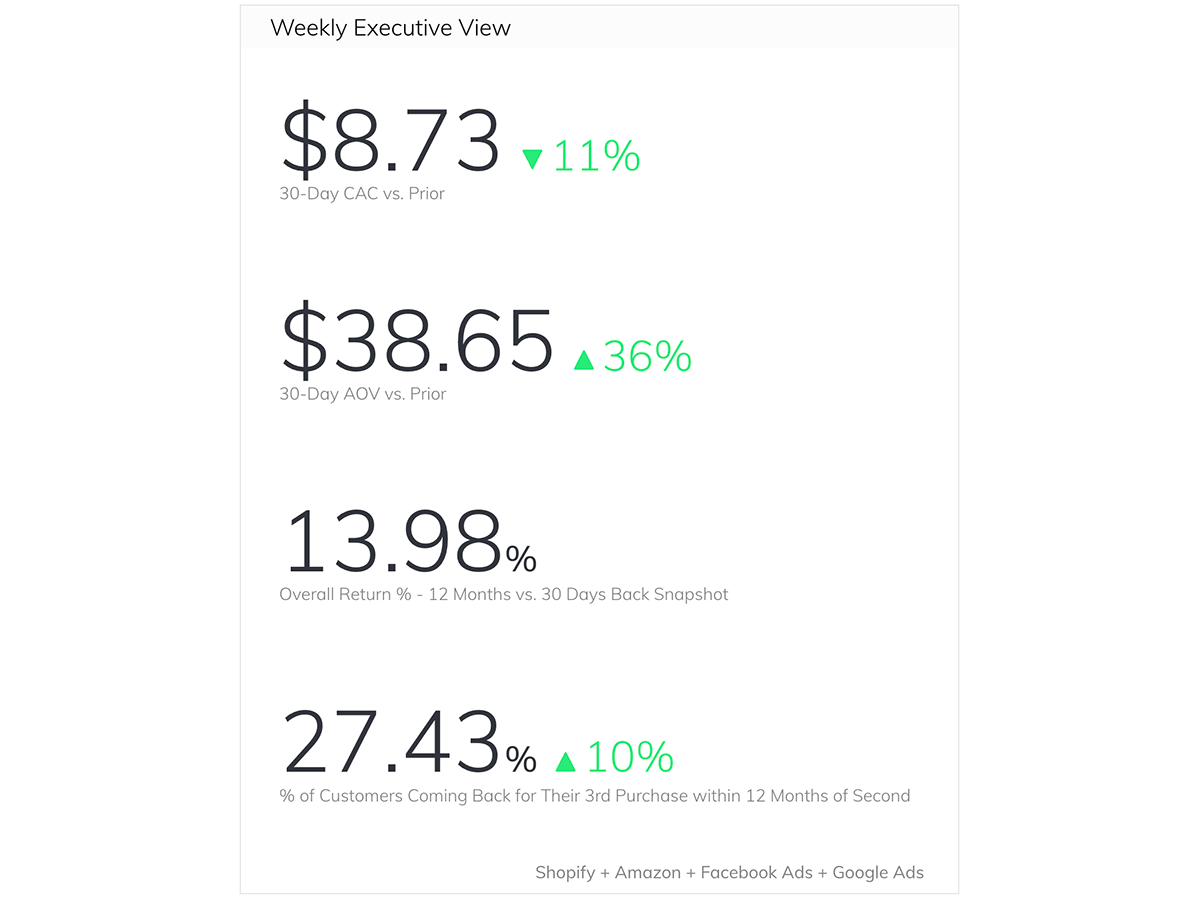
The Feel Good Lab has several important metrics on their executive dashboard, but there are four critical numbers that really tell them how the business is performing: customer acquisition cost (CAC), average order value (AOV), reorder rate, and 12-month customer lifetime value.
Running weekly meetings is important, but the executive dashboard does even more—it helps build better partner relationships.
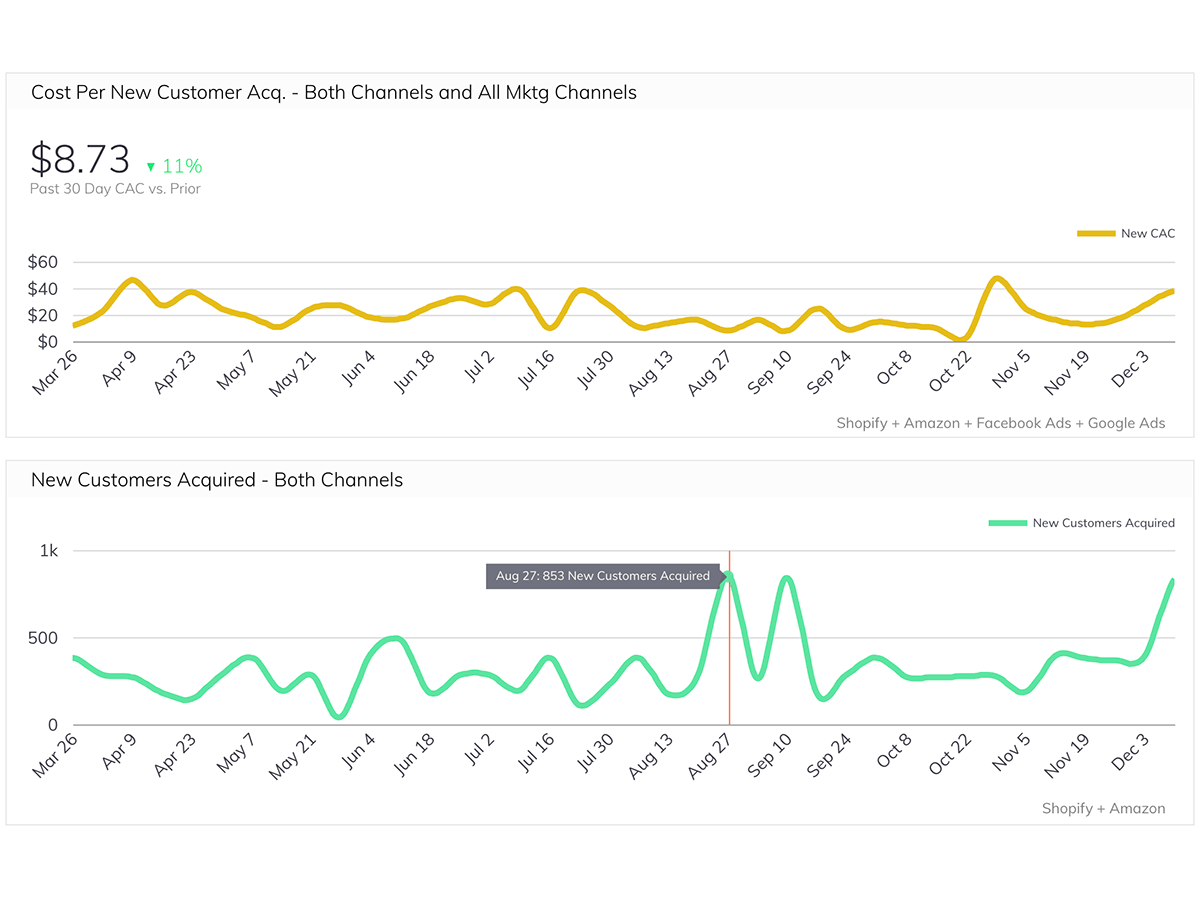
When the Feel Good Lab needed to hire a PPC agency, they knew exactly who they wanted to partner with. But the agency was hesitant. They were concerned they wouldn't get credit for their work—that customers would get convinced on The Feel Good Lab website, but then make their purchases on Amazon. As a result, they weren't sure they could take The Feel Good Lab on as a client.
Thankfully, The Feel Good Lab had data on their side. With Grow, they're able to easily combine CAC across all channels, which gives them an overarching view of the average cost of acquiring a customer. Using this metric to judge performance gives them and their agency partner more freedom to experiment and optimize, and leads to better results.