Teams That Use This Dashboard
Executive
Philanthropy
Marketing
The Younique Foundation is committed to helping and inspiring hope in women who were sexually abused as children or adolescents by providing healing services through retreats, survivor communities, and online resources. They also aim to empower parents and caregivers to protect children from sexual abuse through education and online resources.
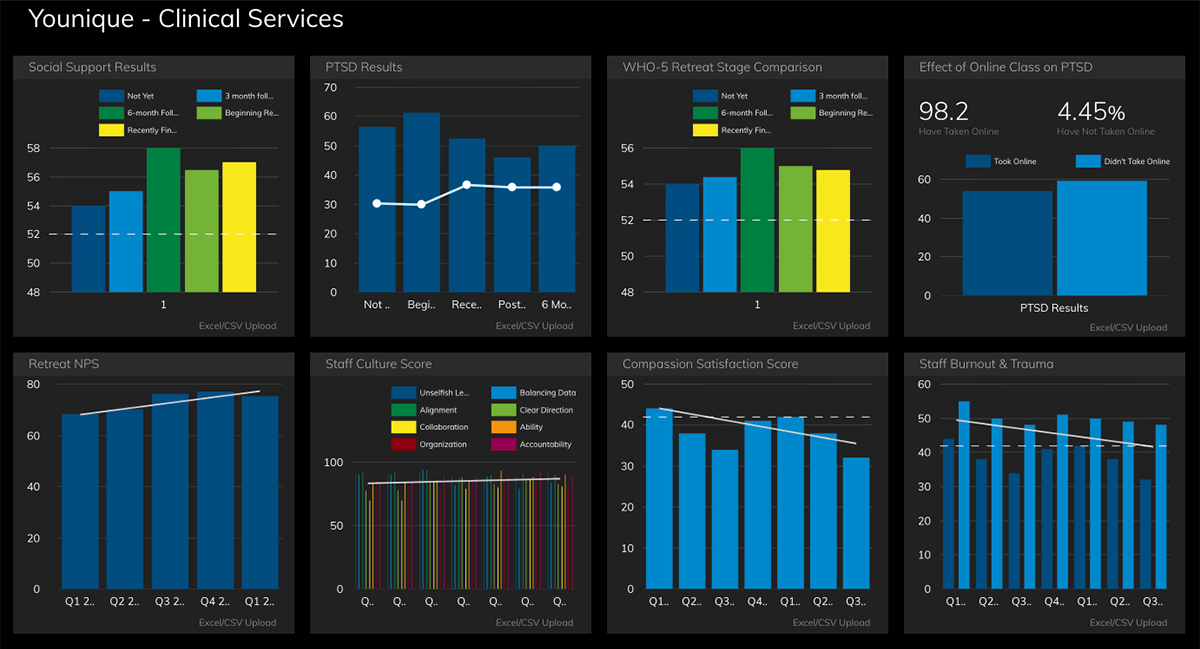
As focused as The Younique Foundation is on bringing resources to sexual abuse survivors, they are just as committed to continuing their outreach for the long haul. Instead of simply examining clients' needs before the retreat, The Younique Foundation aims to continue improving the lives of these women after the retreat to ensure their program is as powerful and helpful as possible. To accomplish this goal, they use a variety of metrics to analyze their effectiveness, all housed on their Clinical Services Dashboard.
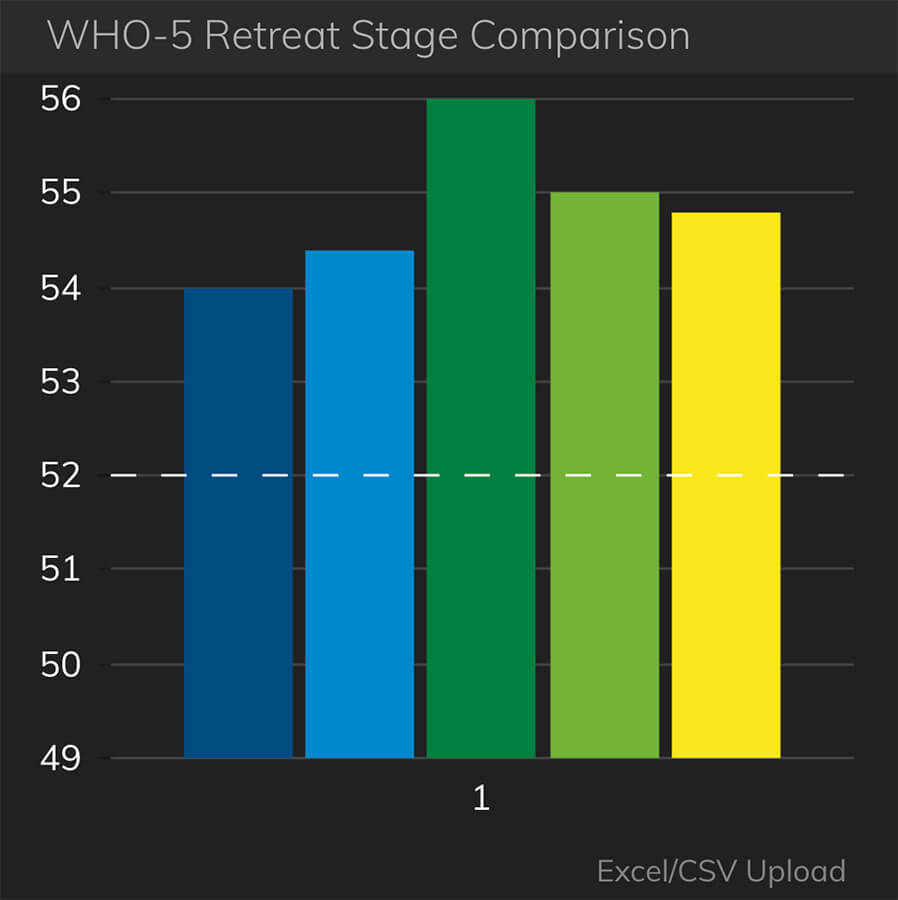
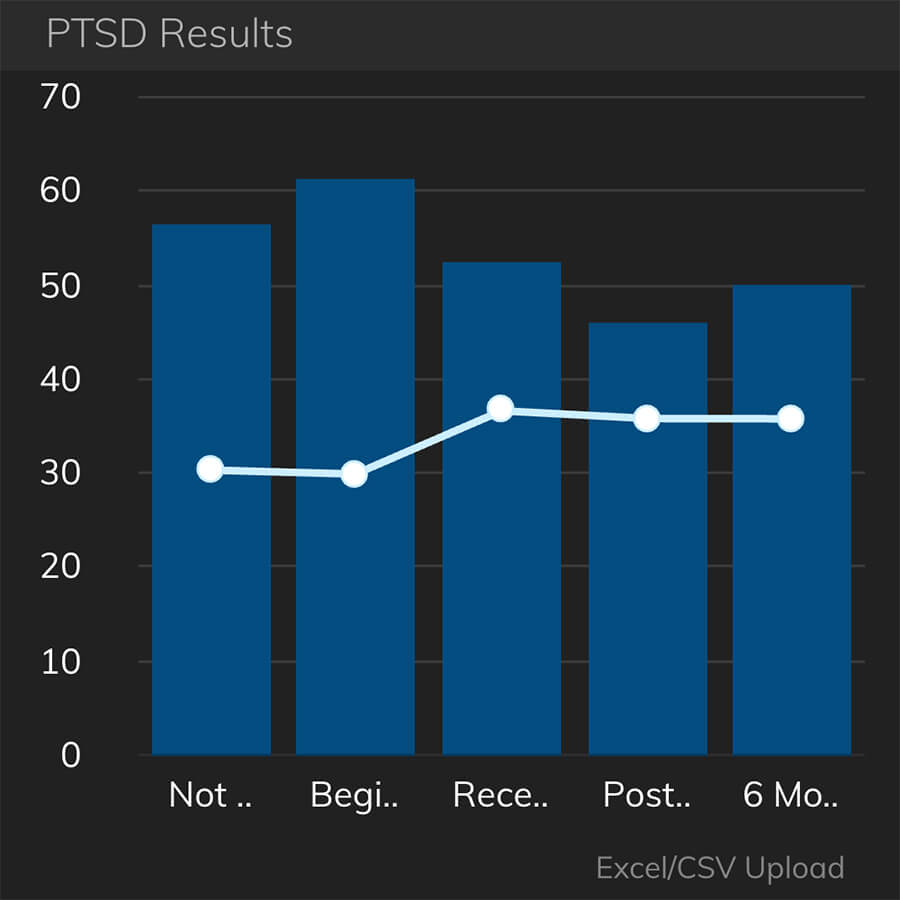
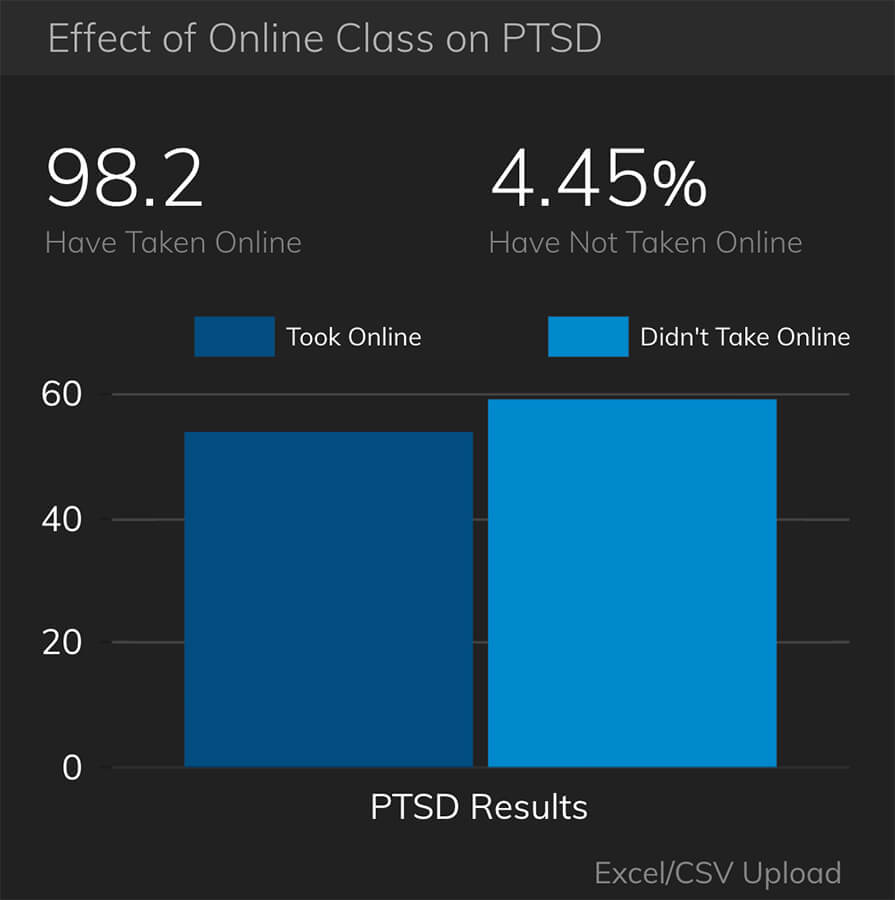
The Younique Foundation focuses on understanding the needs of their participants before, during, and after the retreat. In addition to listening to feedback from survivors during the retreat, they also analyze the real-life progress of participants afterwards, which helps them determine the efficacy of programs. From tracking survivors' reports about their own PTSD scores to analyzing the effects of online resources for participants, they've developed real-time metrics that give their teams the tools they need to make a difference.
Because The Younique Foundation desires to provides world-class services, it uses data from program participant feedback to analyze and adjust program materials. Their dashboards help them visualize where adjustments should be made, communicate changes to their teams, and continue delivering outstanding services.