Teams That Use This Dashboard
Executive
The Feel Good Lab is bringing a modern approach to pain relief. With better ingredients and better products, their 100% natural pain relief cream helps arm the body to do the work of healing—fixing the cause of pain and leading to recovery, instead of just covering up symptoms.
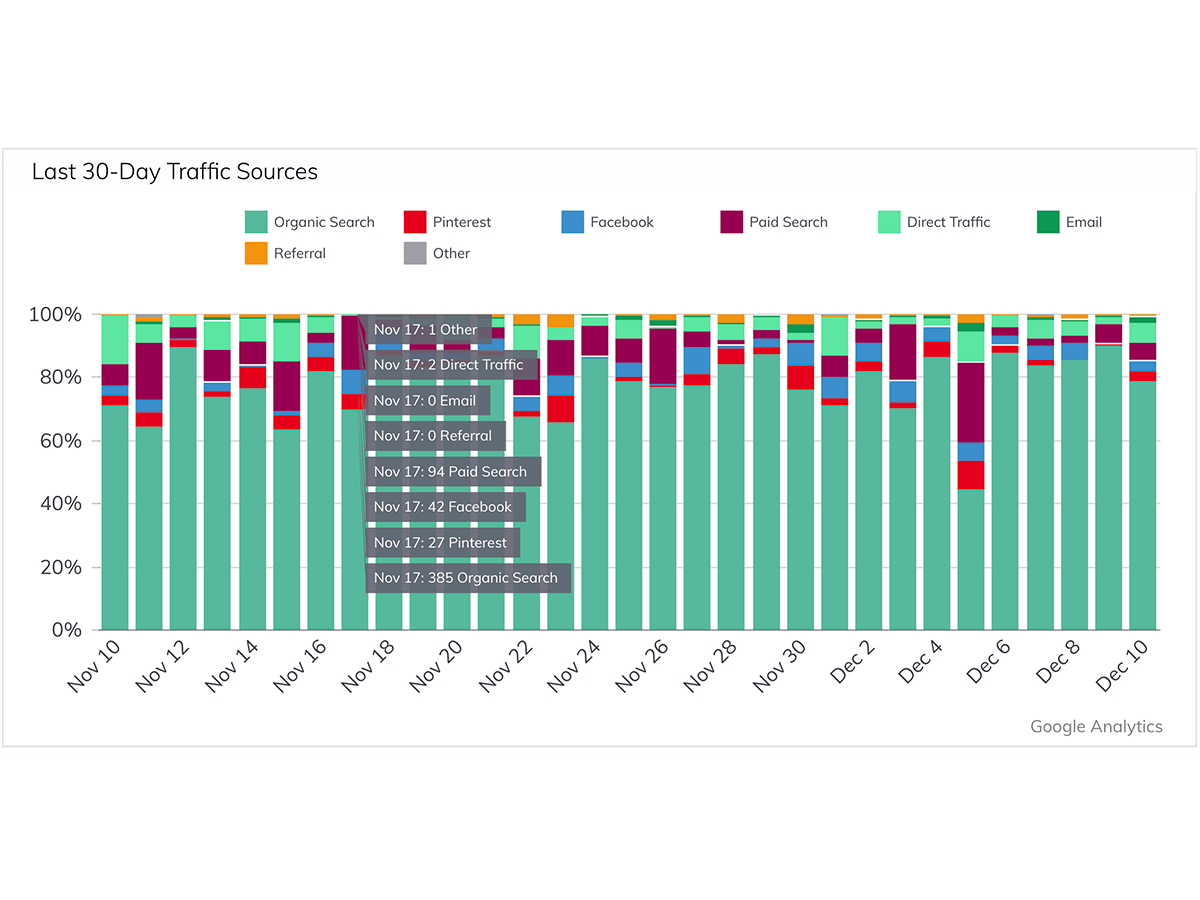
For ecommerce companies like The Feel Good Lab, understanding website performance is crucial for determining promotional timing, customer behaviors, and roadblocks to purchasing. As The Feel Good Lab prepares to increase ad spend and optimize their site, seeing definitive data about what's working, what isn't, and what needs the most attention is non-negotiable. "We want to make sure we always have our foot on the pedal," explains co-founder CJ Forse.
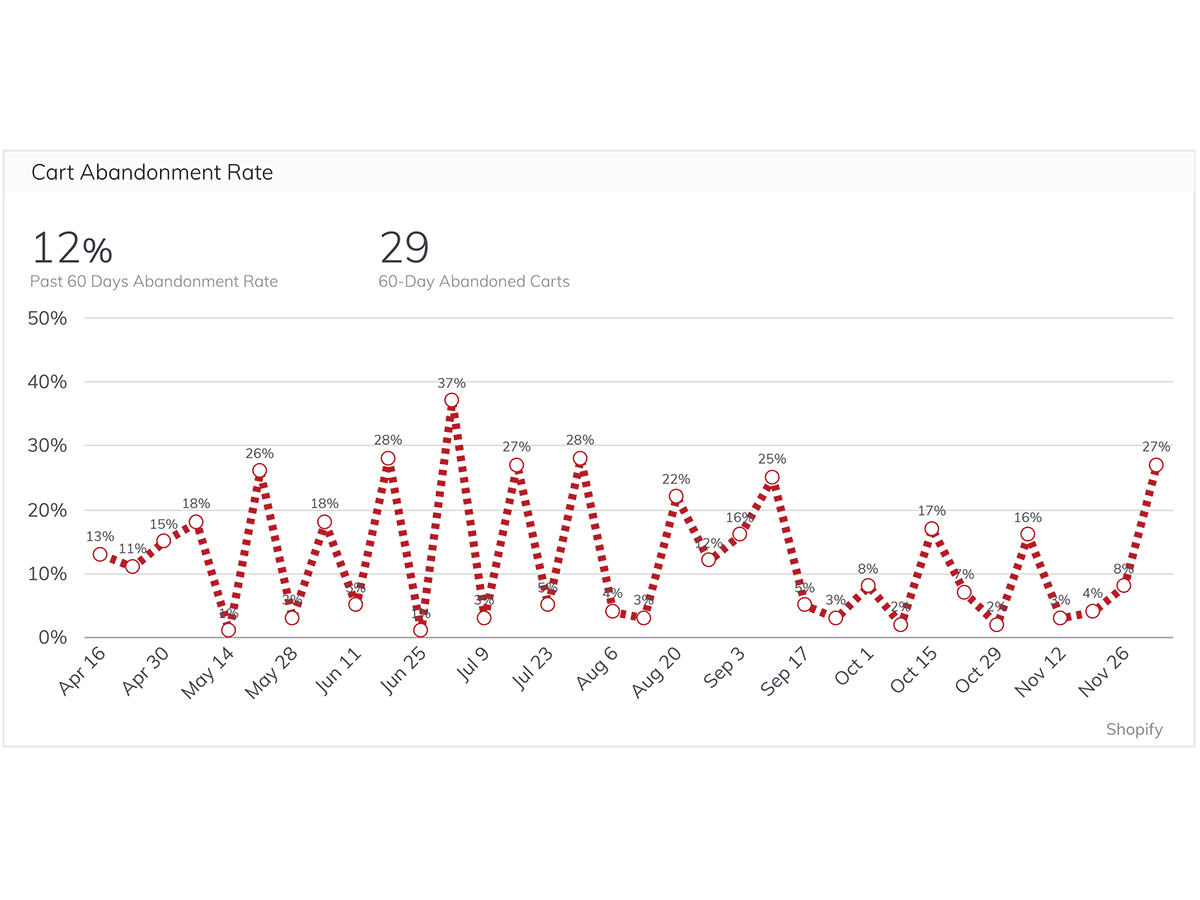
One metric that helps The Feel Good Lab "keep their foot on the pedal" is their cart abandonment rate. "If you're looking at the funnel, the cart is the most critical point," says Forse. "You're putting all this money in to get people to the doorstep, but if they get there and then leave, it's a huge loss."
The Feel Good Lab uses a cart abandonment email sequence to help push people over that final threshold. "It's the easiest place to double your sales," Forse explains. Using the cart abandonment metric helps the team understand how that email sequence is performing, so they can capture as many sales as possible.
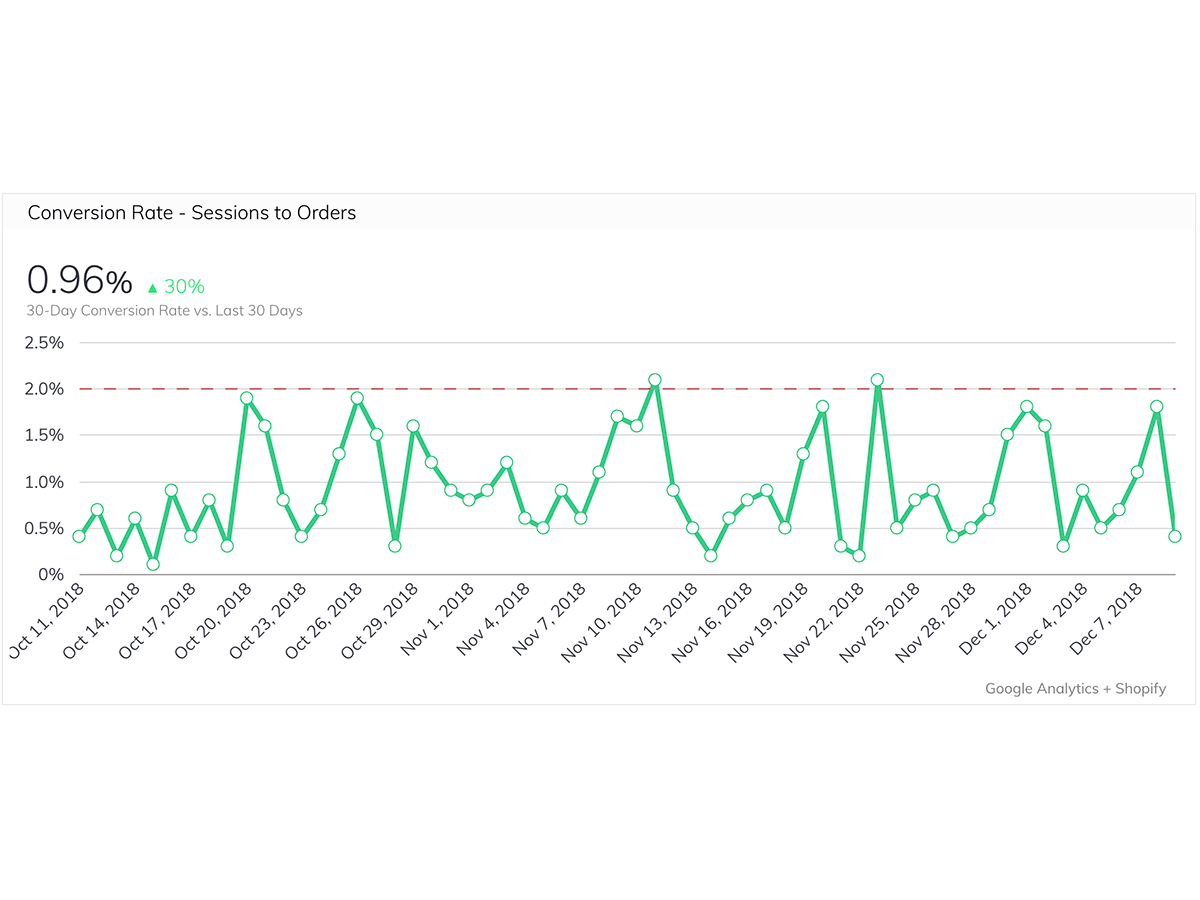
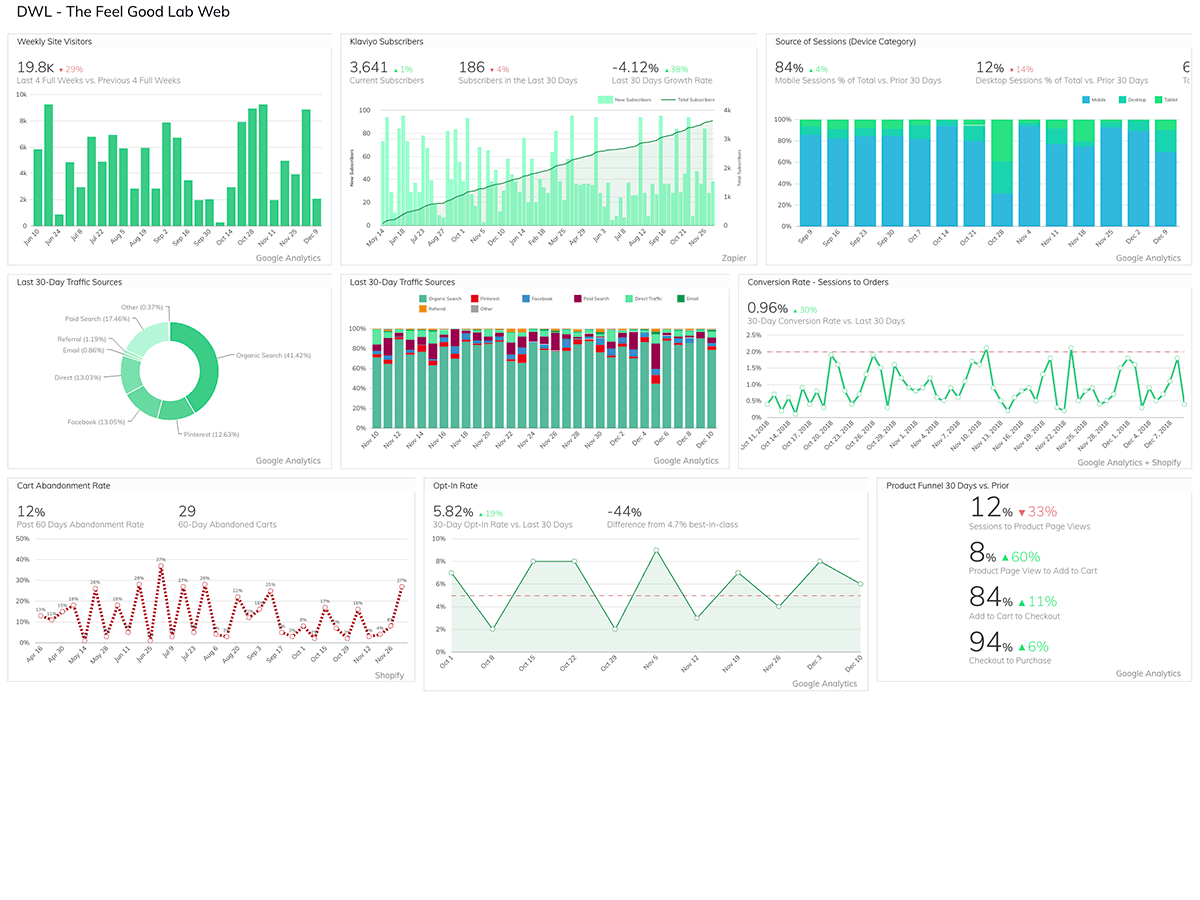
The Feel Good Lab’s Website Performance Dashboard is designed to communicate how their Shopify store is performing in granular detail, while also helping them recognize problems and successes at a glance using comparison indicators. "The thing I look at first is where the problems are," says Forse. "After that, I'm looking for crazy growth—can we replicate it? I want to know that everything is moving correctly."
Though they often know when to expect a downward trend due to fluctuations in inventory or marketing spend, being able to confirm their expectations on their dashboard provides peace of mind. "More often than not, we know why it's red," Forse explains, "That's just what happens when you know your business better."
With their Website Performance Dashboard, The Feel Good Lab is able to understand their business better, solve issues sooner, and seize opportunities to build on new growth. As they increase their investment in paid media and further optimize their website, they'll be more empowered to succeed.